
The Bond Market's Quiet Warning
On Wall Street, there is an old saying that the bond market is smarter than the stock market. While equity traders are often swept up in narratives of growth and innovation, the fixed-income market operates on a colder calculus of risk, inflation, and the future path of interest rates. Its most powerful and widely watched barometer is the yield curve, a simple line on a chart that has historically served as one of the most reliable—if often misunderstood—recession indicators available.
When this curve behaves abnormally, inverting its usual shape, it sends a powerful signal that the institutional players who move trillions of dollars are betting on an economic slowdown. Understanding this signal is crucial for any investor looking to navigate the market cycle.
What Is a Normal Yield Curve?
In its simplest form, the yield curve is a graph that plots the interest rates, or yields, of government bonds of equal credit quality but different maturity dates. Typically, this means comparing the yield on a short-term U.S. Treasury bill (e.g., three months) to a longer-term Treasury note or bond (e.g., two, ten, or thirty years).
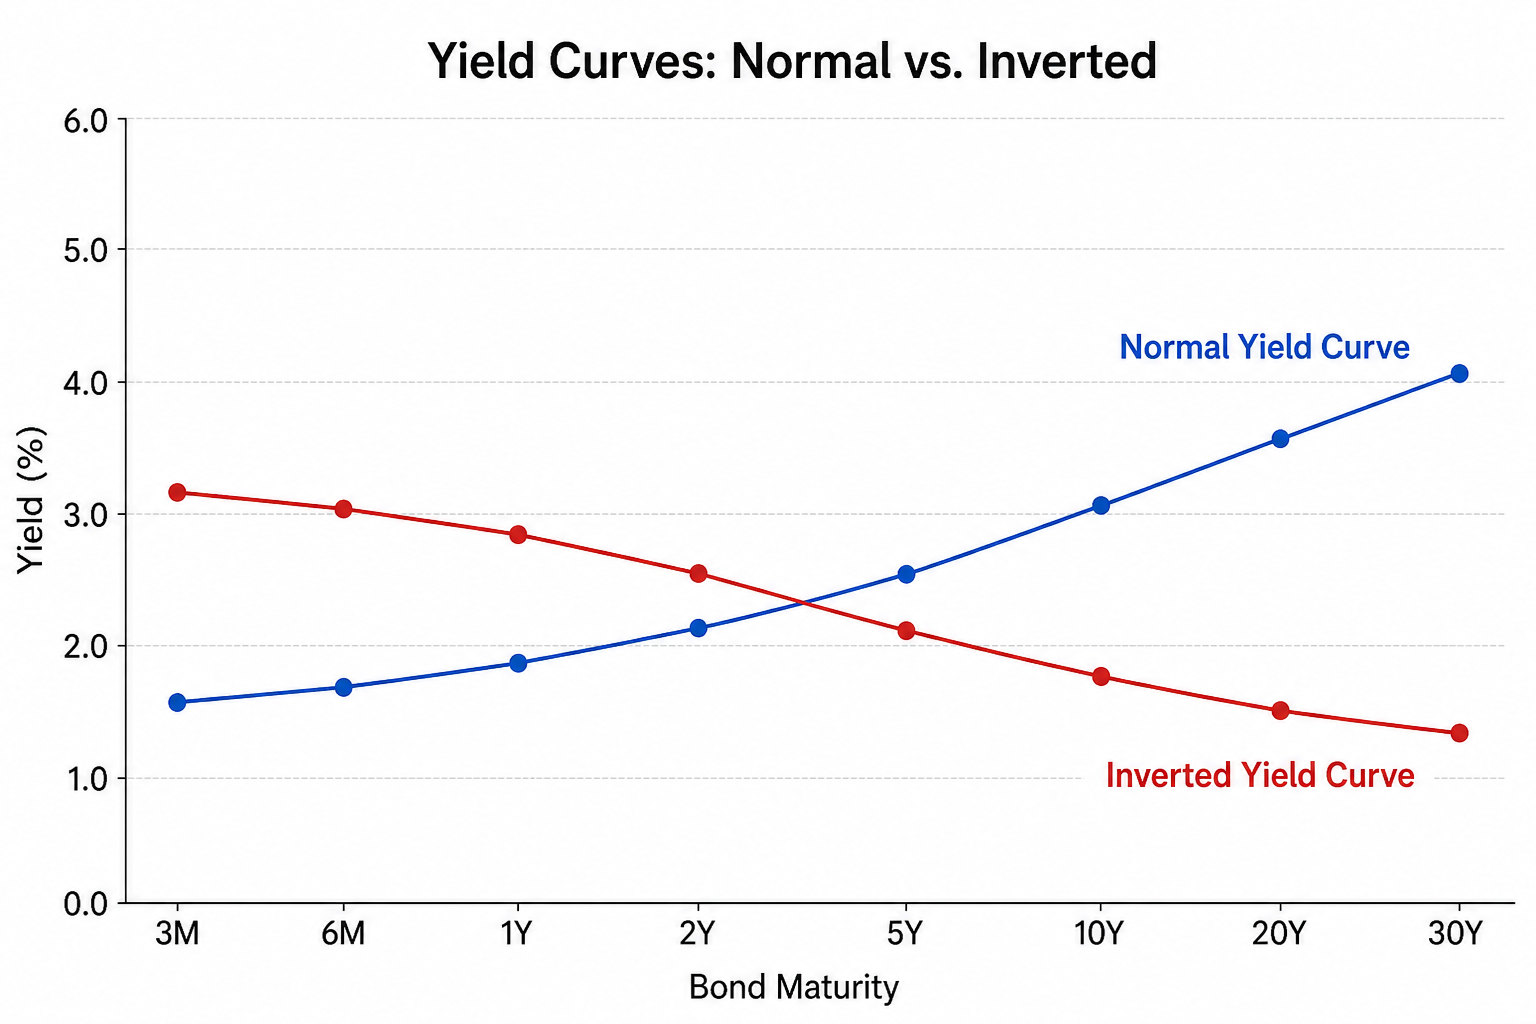
Under normal economic conditions, the curve slopes upward. This is intuitive: an investor lending money to the U.S. government for ten years will demand a higher annual return than someone lending for only three months. This additional return, known as the “term premium,” compensates the lender for the risks of tying up their capital for a longer period, primarily the risk that future inflation will erode their returns.
The Inversion: When the Future Looks Worse Than the Present
An inverted yield curve occurs when this logic flips on its head—when short-term Treasury yields rise above long-term yields. The most closely watched metrics for this phenomenon are the spread between the 10-year and 2-year Treasury yields, and the 10-year and 3-month yields. When those spreads turn negative, the curve is said to be inverted.
This inversion is not an academic exercise; it is the result of powerful market forces sending a specific message:
- Aggressive Monetary Policy: Inversions are often triggered when the Federal Reserve is aggressively raising its short-term policy rate to combat inflation. This directly pushes up the yields on short-term bonds.
- Pessimistic Long-Term Outlook: At the same time, investors begin to fear that the Fed’s rate hikes will eventually choke off economic growth, leading to a future recession. In anticipation, they buy long-term bonds, which are considered a safe haven during downturns. This high demand pushes the price of long-term bonds up and, consequently, their yields down.
The result is an environment where the market is demanding more compensation for holding a 2-year bond than a 10-year bond. In effect, the collective wisdom of the bond market is forecasting that the high rates of today are temporary and that the Fed will eventually be forced to cut rates to stimulate a flagging economy in the future.
A Formidable Track Record
The reason an inverted yield curve commands so much attention is its historical reliability. An inversion of the 10-year/2-year spread has preceded every U.S. recession for the past 50 years. However, it is a leading indicator, not a concurrent one. The lag between an initial inversion and the official start of a recession has historically varied, typically ranging from six to 24 months. This makes it less a tool for market timing and more a signal to assess portfolio risk.
Limits of the Signal: Is This Time Different?
While its track record is formidable, financial markets are not governed by immutable laws. The most recent and prolonged yield curve inversion has yet to coincide with a formally declared U.S. recession, leading many to question whether the signal has lost its potency. Several structural shifts in the market may be distorting the curve’s traditional message:
- The Legacy of Quantitative Easing (QE): Years of central bank bond-buying programs held down long-term yields globally. This may have created a structural bias that makes inversions more likely to occur, even with less aggressive Fed tightening.
- Global Capital Flows: As the world’s primary reserve currency, U.S. Treasurys attract immense demand from international investors seeking safety. This persistent demand can suppress long-term yields, flattening the curve irrespective of the domestic economic outlook.
These factors do not invalidate the yield curve as an indicator, but they add critical context. The signal may still be directionally correct, but its calibration could be different in today’s post-QE world.
What the Yield Curve Tells Investors Now
The yield curve is not a crystal ball. It is a snapshot of the bond market's expectations. For a serious investor, an inversion is not a directive to sell everything, but rather a prompt to ask the hard questions that define every market cycle: Is my portfolio prepared for a period of slower growth? What happens to my investments when liquidity tightens? The enduring lesson from the bond market is that expectations for tomorrow, more than the reality of today, are what ultimately set the price of risk.
This article is for informational purposes only and should not be considered investment advice. Financial markets are complex, and readers should consult with a qualified professional before making any investment decisions.
